VTEC Time Series
Contact: iono@oma.be
|
The ionospheric Vertical Total Electron Content (VTEC) is extracted from the near-real time European VTEC maps at 3 different locations (Figure 1):
a) Northern part of Europe (lon: 5°; lat: 61°, top) Figure 2 shows the VTEC (in red), the VTEC normal quiet behaviour (median of the 15 previous days with its standard deviation in grey), and the variability of the VTEC during the 5 minute time span of the map (in blue, right scale). Figure 3 shows the VTEC difference (in green) and relative difference (in blue, right scale) with respect to VTEC normal quiet behaviour. |
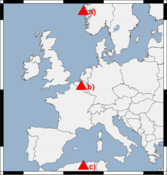 Figure 1: VTEC extracting point locations |
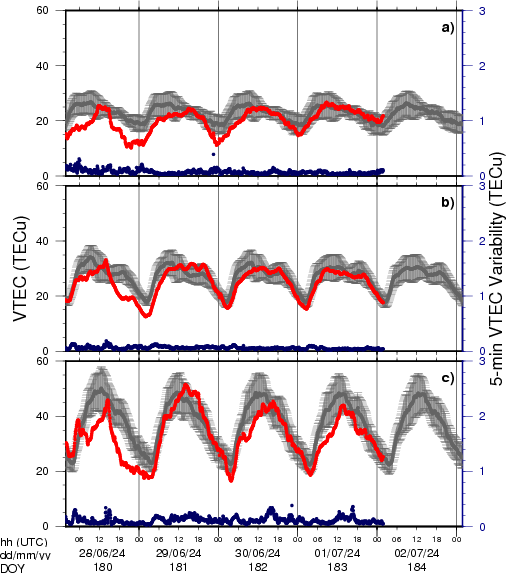 Figure 2: Time Series of the VTEC (in red), the VTEC median of the last 15 days (in grey) and the 5-min VTEC variability (in blue) in the North, Mid and South of Europe |
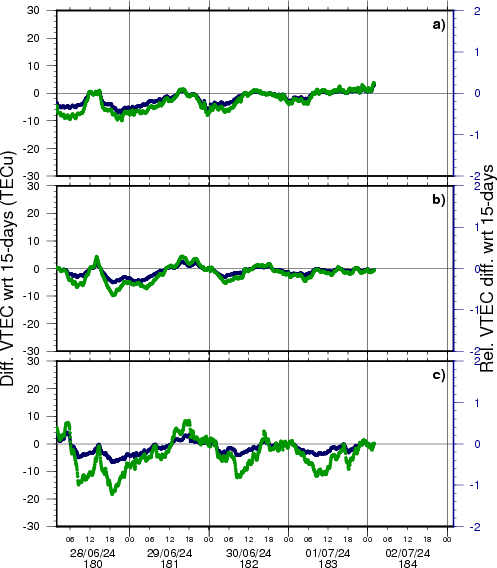 Figure 3: Time Series of the VTEC difference (in green) and relative difference (in blue) w.r.t. the median of the last 15 days in the North, Mid and South of Europe |