Interactive Ionospheric Maps
Contact: iono@gnss.be
|
Mouse position |
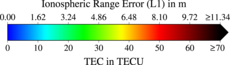
Click on the map to get the Vertical Total Electron Content (VTEC) value at a particular point.
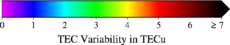
The VTEC variability maps show the variation of the VTEC at the Ionospheric Piercing Points (IPP) during the 5 minutes of time span. These maps can be seen by clicking on the box "Variability" in the "Layers opacity" part.
IPPs are represented in the maps as small circles.